Market Index
Everything below is the 9″ Tech Moody. It has a retail price until it leaves the shop; after that it has a market value, and the Village calculates it from what collectors actually do — verified sales first, then live bids and asks, then how many authenticated pieces are left. MMX is the 9″ alone. Sealed 6″ plush — still in the wrap — trade on their own index, MMX-S, and both roll up into the MMX Composite below. Want every figure on one screen? Open the terminal →
The Market Index is bigger than one house. Moody Mobb's 9″ Tech Moody, 6″ plush and cars are where it starts, not where it stops. The Village is built for many houses — makers of art toys, timepieces, sneakers, handbags, ceramics, sculpture, cards and other limited luxury collectibles — each with its own capped runs, its own pieces authenticated against the same registry, and its own line on this board. The houses shown today are illustrative; as real houses join, the market covers all of them.
- Houses
- 45
- 1 live · 44 illustrative
- Moody Mobb pieces
- 195,580
- 18 editions · hard caps
- Illustrative house pieces
- 113,643
- demonstration · not inventory
- All capped pieces
- 309,223
- every run, at its cap
- Sell-out at issue · all houses
- $1,081,211,302
- Moody Mobb $86,784,302 · houses $994,427,000
- Issued · registry
- 0
- recorded as sold
Simulated market data
No verified sales exist yet, so these figures come from a deterministic simulation to show the engine working. The maths is real; the trades are not. Verified sales appear as the registry records them; the simulated examples and modeled estimates keep their own labels.
Verified market data
What is this?- Last verified sale
- None yet
- Verified sales volume · all time
- $0
- Completed verified trades · all time
- 0
- Verified high
- —
- Verified low
- —
- Verified average sale
- —
- Verified secondary GMV
- $0
- Verified creator royalties
- $0
- Verified Village fees
- $0
Modeled market data
What is this?- MMX modeled level
- 1414.56
- Modeled market value · 9″
- $34.2M
- Modeled value change vs issue
- +27.32%
- Authenticated active supply · 9″
- 17,581
- Modeled Village composite value
- $80.1M
Modeled line value · 9″
- MP-05 Think Rich
- $6.6M
- MP-03 KQL
- $5.8M
- MP-07 West Canna
- $5.6M
- MP-06 Vex
- $3.5M
- MP-02 BlkHrt
- $3.5M
- MP-01 Aiko
- $3.2M
- MP-04 Psalm
- $3.2M
- MP-08 WolfsBane
- $2.7M
Demonstration: the market figures on this site are a 180-day simulation of growth and fluctuation, modelled on comparable collectible markets and driven in part by example press coverage and celebrity and influencer endorsements, to show how the Terminal works — and are labelled so. None of that news happened, and none is a price, a sale or a trade. With the demonstration off, every figure comes only from real, verified sales.
The rule: verified data can influence modeled data. Modeled data can never pretend to be verified data.
Modeled Market Value is an estimate calculated from authenticated supply and market inputs. Verified Market Value and transaction statistics are based only on completed, authenticated, financially settled transactions recorded in the Registry. How these numbers are calculated — Methodology →
Index · 180 days
Open the workspace → — the same figures as eight panels on one screen, keyed 1–8. This index covers the eight Moody Mobb lines. See the index at category scale → — the same arithmetic over 44 further illustrative houses, kept separate from the live number.
The market by segment
Counted the way an exchange counts: each index covers what is listed and tradable, weighted by market cap — price times units — and the composite adds them up. MMX is the 9″ Tech Moody. MMX-S is the 6″ plush still sealed in its wrap; an opened plush is not quoted. Vehicles, the 12″ Special Edition and kits have no market until their release opens, so they are shown at issue value and left out of every total.
Market by segment
SOURCE · SIMULATED · DEMONSTRATION| Index | Covers | Units listed | Market cap | Level | vs issue | Share |
|---|---|---|---|---|---|---|
| MMX | 9″ Tech Moody — all surviving pieces | 17,591 | $34,200,286 | 1414.29 | ▲ +27.30% | 42.7% |
| MMX-S | 6″ plush, sealed in its wrap | 125,958 | $45,883,555 | 1308.24 | ▲ +17.75% | 57.3% |
| MMX Composite | Every listed segment, cap-weighted | 143,549 | $80,083,841 | 1351.52 | ▲ +21.65% | 100% |
MMX-S · sealed 6″ plush
SOURCE · SIMULATED · DEMONSTRATION| Plate | Name | Sealed | Of run | Issue | Last | vs issue | Market cap |
|---|---|---|---|---|---|---|---|
| MP-01 | Aiko | 14,942 | 22,220 | $222 | $260 | ▲ +17.12% | $3,884,920 |
| MP-02 | BlkHrt | 14,558 | 22,220 | $222 | $277 | ▲ +24.77% | $4,032,566 |
| MP-03 | KQL | 14,976 | 22,220 | $444 | $564 | ▲ +27.03% | $8,446,464 |
| MP-04 | Psalm | 14,055 | 22,220 | $222 | $268 | ▲ +20.72% | $3,766,740 |
| MP-05 | Think Rich | 17,096 | 22,220 | $444 | $490 | ▲ +10.36% | $8,377,040 |
| MP-06 | Vex | 16,090 | 22,220 | $222 | $242 | ▲ +9.01% | $3,893,780 |
| MP-07 | West Canna | 17,491 | 22,220 | $444 | $495 | ▲ +11.49% | $8,658,045 |
| MP-08 | WolfsBane | 16,750 | 22,220 | $222 | $288 | ▲ +29.73% | $4,824,000 |
Not listed yet
SOURCE · CATALOGUE| Line | Units | Issue price | Value at issue | Status |
|---|---|---|---|---|
| Moody Vehicle | 11,110 | $1,111 | $12,343,210 | HELD |
| Moody Vehicle — premium | 6,666 | $2,222 | $14,811,852 | HELD |
| Celebrity Vehicle | 2,222 | — | — | HELD |
| Twelve-Inch Special Edition | 2,222 | — | — | HELD |
| Moody Kit | 22 | $22,000 | $484,000 | HELD |
How many exist
The character animals, in soft plush. No technology inside. Not an edition, not quoted, and not on any chart here — 22,220 per character.
Every human-form Moody that will ever exist for the public. The number does not move when a new character is released.
Never publicly sold, in 22 standing chests. Held outside the cap — a piece nobody can buy is not supply you are bidding against.
The standing chest edition at $22,000 — twenty-two worldwide, and the scarcest thing the house sells. Each holds a numbered Moody, so kits spend cap like any other release.
Ten plush for every Tech Moody, character by character. 22,220 against 2,222, on all eight. The two are not drawn on one axis anywhere on this page: at ten to one the collectible flattens into the baseline and the chart starts telling you something false about the comparison. The ratio is the comparison.
Where the 22,220 go
The architectural layer
A mansion is a building, not a doll. It is its own product class and it does not consume Tech Moody supply — if it did, selling one would silently destroy a numbered edition slot.
22.22 sq ft each across the three-floor configuration — 488.84 sq ft of collectible floor area in total.
22 ever, every one a different design — 488.84 sq ft in total.
Every mansion ever built, laid end to end. Small enough to audit, which is the point of a number like this.
22 × $444,000, the starting price. Every one a different build — there is no second run.
Primary sellout value
What every line is worth if it sells out once, at issue price. This is gross primary circulation — it is not profit, not revenue booked, and not a prediction. It excludes resale royalties, transaction fees, secondary-market activity, licensing, collaborations and sponsorships entirely. Where the money goes, in plain English →
Full sell-out · every priced item · $113,939,364
SOURCE · CATALOGUE| Category | Units | Sold out at issue | Share |
|---|---|---|---|
| 6″ plush — $222 and $444 | 177,760 | $54,261,240 | 47.6% |
| 9″ Tech Moody — $1,111 and $2,222 | 17,776 | $27,155,062 | 23.8% |
| Cars and bikes — 2,222 per character, 17,776 in all | 17,776 | $27,155,062 | 23.8% |
| Moody Kit | 22 | $484,000 | 0.4% |
| Moody Mansion | 22 | $4,884,000 | 4.3% |
| Celebrity mansions and kits — list value, not a public sale | 44 | Not a sale — excluded | — |
| Not yet priced — 12″ Special Edition, celebrity Tech Moody, celebrity vehicles | 13,332 | Not yet priced | — |
| TOTAL | — | $113,939,364 | 100% |
Unpriced lines contribute zero. The Vault and the 8,888 celebrity Tech Moodys have no issue price yet, so they are counted at nothing rather than at a guess — a guessed price in a headline figure is fiction with a dollar sign on it. Celebrity mansions and kits are made for a named person, not sold to the public, so their list values are shown but never added to sales. Every number above is computed from one config file; none of it is typed into this page.
Supply
9″ Tech Moodys minted across the 8 released characters.
Authenticated and free to trade.
Reported stolen or disputed. Cannot trade — but still counted as existing.
Destroyed or tampered past repair, confirmed by the chip. Gone permanently.
Why frozen and burned are not the same number. Burning a piece tightens supply and lifts every surviving piece. Freezing one does not — a frozen piece still counts as existing in the scarcity maths. If theft tightened supply, stealing pieces would raise the value of the ones the thief kept, and the market would be paying people to steal. It never does.
The Village Marketplace
Collectibles from other houses, built with the Village system inside them — plate, chip and registry — trade here on the same rails as a Moody. The 44 below are an illustrative worked example: made-up names, simulated, and never counted in MMX.
Global Markets
DELAYED · FREE SOURCES- New York S&P 500▲ +21.38 (+0.28%)
- London FTSE 100▲ +7.96 (+0.07%)
- Frankfurt DAX▲ +113.25 (+0.44%)
- Hong Kong Hang Seng▼ −116.97 (−0.50%)
- Tokyo Nikkei 225▲ +685.79 (+1.08%)
- Sydney ASX 200▲ +37.40 (+0.42%)
For context only, not for trading. Until the paid feed is connected these come from free public sources, each with its own delay: crypto from CoinGecko (about 1–2 min); stocks, indices, futures and currencies from Yahoo Finance (15+ min (stocks, indices) · 10–30 min (futures)). This page also holds each quote for up to 60 seconds. The Age column is how old each price is right now; outside trading hours it is the last close. A dash means the source did not answer — nothing is estimated.
| Market | Symbol | Last | P&L | Chg | As of | Age | Typical delay |
|---|---|---|---|---|---|---|---|
| United States | |||||||
| SPX | 7,743.98 | +21.38 | ▲ 0.28% | 20:20 UTC | 38 min | 15+ min · Yahoo Finance | |
| NDX | 29,813.16 | +161.71 | ▲ 0.55% | 20:57 UTC | 4 s | 15+ min · Yahoo Finance | |
| COMP | 26,549.85 | +72.04 | ▲ 0.27% | 20:57 UTC | 3 s | 15+ min · Yahoo Finance | |
| US30 | 52,475.10 | +97.53 | ▲ 0.19% | 20:20 UTC | 38 min | 15+ min · Yahoo Finance | |
| RUT | 2,830.51 | +11.64 | ▲ 0.41% | 20:30 UTC | 28 min | 15+ min · Yahoo Finance | |
| VIX | 16.91 | −0.61 | ▼ 3.48% | 20:15 UTC | 43 min | 15+ min · Yahoo Finance | |
| AAPL | 343.83 | −3.27 | ▼ 0.94% | 20:00 UTC | 58 min | 15+ min · Yahoo Finance | |
| MSFT | 531.01 | −0.32 | ▼ 0.06% | 20:00 UTC | 58 min | 15+ min · Yahoo Finance | |
| NVDA | 215.38 | −2.56 | ▼ 1.17% | 20:00 UTC | 58 min | 15+ min · Yahoo Finance | |
| AMZN | 254.60 | +1.50 | ▲ 0.59% | 20:00 UTC | 58 min | 15+ min · Yahoo Finance | |
| GOOGL | 324.89 | +4.31 | ▲ 1.34% | 20:00 UTC | 58 min | 15+ min · Yahoo Finance | |
| META | 612.49 | −7.70 | ▼ 1.24% | 20:00 UTC | 58 min | 15+ min · Yahoo Finance | |
| TSLA | 404.22 | −3.24 | ▼ 0.80% | 20:00 UTC | 58 min | 15+ min · Yahoo Finance | |
| BRK.B | 540.34 | −2.65 | ▼ 0.49% | 20:00 UTC | 58 min | 15+ min · Yahoo Finance | |
| JPM | 339.30 | +3.51 | ▲ 1.05% | 20:00 UTC | 58 min | 15+ min · Yahoo Finance | |
| V | 400.60 | −1.26 | ▼ 0.31% | 20:00 UTC | 58 min | 15+ min · Yahoo Finance | |
| MA | 610.31 | +0.46 | ▲ 0.08% | 20:00 UTC | 58 min | 15+ min · Yahoo Finance | |
| UNH | 407.10 | −3.29 | ▼ 0.80% | 20:00 UTC | 58 min | 15+ min · Yahoo Finance | |
| LLY | 1,288.30 | +6.39 | ▲ 0.50% | 20:03 UTC | 55 min | 15+ min · Yahoo Finance | |
| JNJ | 271.04 | +2.31 | ▲ 0.86% | 20:00 UTC | 58 min | 15+ min · Yahoo Finance | |
| XOM | 182.02 | +2.11 | ▲ 1.17% | 20:02 UTC | 55 min | 15+ min · Yahoo Finance | |
| CVX | 229.20 | +0.97 | ▲ 0.43% | 20:03 UTC | 55 min | 15+ min · Yahoo Finance | |
| WMT | 118.77 | −0.55 | ▼ 0.46% | 20:00 UTC | 58 min | 15+ min · Yahoo Finance | |
| COST | 982.73 | −9.40 | ▼ 0.95% | 20:00 UTC | 58 min | 15+ min · Yahoo Finance | |
| KO | 91.73 | +0.55 | ▲ 0.60% | 20:00 UTC | 58 min | 15+ min · Yahoo Finance | |
| PEP | 132.63 | −0.87 | ▼ 0.65% | 20:00 UTC | 58 min | 15+ min · Yahoo Finance | |
| MCD | 250.50 | +1.03 | ▲ 0.41% | 20:00 UTC | 58 min | 15+ min · Yahoo Finance | |
| NKE | 37.15 | −0.41 | ▼ 1.09% | 20:00 UTC | 58 min | 15+ min · Yahoo Finance | |
| DIS | 109.04 | −1.19 | ▼ 1.08% | 20:03 UTC | 54 min | 15+ min · Yahoo Finance | |
| NFLX | 61.99 | −0.53 | ▼ 0.85% | 20:00 UTC | 58 min | 15+ min · Yahoo Finance | |
| AMD | 578.44 | +18.18 | ▲ 3.24% | 20:00 UTC | 58 min | 15+ min · Yahoo Finance | |
| INTC | 95.53 | +1.79 | ▲ 1.91% | 20:00 UTC | 58 min | 15+ min · Yahoo Finance | |
| AVGO | 351.81 | +9.48 | ▲ 2.77% | 20:00 UTC | 58 min | 15+ min · Yahoo Finance | |
| TSM | 439.51 | +2.64 | ▲ 0.60% | 20:00 UTC | 58 min | 15+ min · Yahoo Finance | |
| ORCL | 144.54 | +14.01 | ▲ 10.73% | 20:03 UTC | 54 min | 15+ min · Yahoo Finance | |
| CRM | 242.11 | +1.22 | ▲ 0.51% | 20:00 UTC | 58 min | 15+ min · Yahoo Finance | |
| PLTR | 196.81 | −1.92 | ▼ 0.97% | 20:00 UTC | 58 min | 15+ min · Yahoo Finance | |
| BAC | 50.85 | +0.17 | ▲ 0.34% | 20:00 UTC | 58 min | 15+ min · Yahoo Finance | |
| GS | 925.17 | +13.40 | ▲ 1.47% | 20:00 UTC | 58 min | 15+ min · Yahoo Finance | |
| BA | 167.14 | −1.04 | ▼ 0.62% | 20:00 UTC | 58 min | 15+ min · Yahoo Finance | |
| PFE | 29.45 | −0.35 | ▼ 1.17% | 20:02 UTC | 55 min | 15+ min · Yahoo Finance | |
| COIN | 162.32 | +1.23 | ▲ 0.76% | 20:00 UTC | 58 min | 15+ min · Yahoo Finance | |
| MSTR | 145.16 | +3.76 | ▲ 2.66% | 20:00 UTC | 58 min | 15+ min · Yahoo Finance | |
| GME | 23.33 | −0.03 | ▼ 0.13% | 20:00 UTC | 58 min | 15+ min · Yahoo Finance | |
| HOOD | 91.43 | −3.13 | ▼ 3.31% | 20:00 UTC | 58 min | 15+ min · Yahoo Finance | |
| UBER | 65.27 | −0.51 | ▼ 0.78% | 20:00 UTC | 58 min | 15+ min · Yahoo Finance | |
| Americas | |||||||
| TSX | 36,265.09 | +93.60 | ▲ 0.26% | 20:20 UTC | 38 min | 15+ min · Yahoo Finance | |
| BVSP | 171,006.10 | −4,703.95 | ▼ 2.68% | 20:18 UTC | 40 min | 15+ min · Yahoo Finance | |
| MXX | 69,182.39 | −529.48 | ▼ 0.76% | 20:26 UTC | 32 min | 15+ min · Yahoo Finance | |
| SHOP | 235.47 | +2.54 | ▲ 1.09% | 20:00 UTC | 58 min | 15+ min · Yahoo Finance | |
| RY | 286.41 | +0.95 | ▲ 0.33% | 20:00 UTC | 58 min | 15+ min · Yahoo Finance | |
| Europe | |||||||
| SX5E | 6,167.81 | +3.12 | ▲ 0.05% | 17:00 UTC | 4 h | 15+ min · Yahoo Finance | |
| UKX | 10,694.50 | +7.96 | ▲ 0.07% | 16:35 UTC | 4 h | 15+ min · Yahoo Finance | |
| DAX | 25,704.02 | +113.25 | ▲ 0.44% | 17:00 UTC | 4 h | 15+ min · Yahoo Finance | |
| CAC | 7,886.96 | −0.18 | ▼ 0.00% | 17:05 UTC | 4 h | 15+ min · Yahoo Finance | |
| IBEX | 18,883.50 | −277.10 | ▼ 1.45% | 16:35 UTC | 4 h | 15+ min · Yahoo Finance | |
| ATA | — | — | — | — | — | 15+ min · Yahoo Finance | |
| ASML | 1,489.60 | +19.60 | ▲ 1.33% | 16:35 UTC | 4 h | 15+ min · Yahoo Finance | |
| MC | 385.00 | −3.25 | ▼ 0.84% | 16:36 UTC | 4 h | 15+ min · Yahoo Finance | |
| RMS | 1,259.50 | −9.00 | ▼ 0.71% | 16:35 UTC | 4 h | 15+ min · Yahoo Finance | |
| SAP | 211.20 | −1.95 | ▼ 0.91% | 16:35 UTC | 4 h | 15+ min · Yahoo Finance | |
| NESN | 82.81 | −0.44 | ▼ 0.53% | 16:30 UTC | 4 h | 15+ min · Yahoo Finance | |
| NOVO | 255.00 | −4.50 | ▼ 1.73% | 15:59 UTC | 5 h | 15+ min · Yahoo Finance | |
| SHEL | 3,956.50 | +29.00 | ▲ 0.74% | 16:35 UTC | 4 h | 15+ min · Yahoo Finance | |
| Asia-Pacific | |||||||
| N225 | 63,954.19 | +685.79 | ▲ 1.08% | 06:45 UTC | 14 h | 15+ min · Yahoo Finance | |
| HSI | 23,094.83 | −116.97 | ▼ 0.50% | 08:08 UTC | 13 h | 15+ min · Yahoo Finance | |
| SSEC | 3,681.47 | −16.05 | ▼ 0.43% | 07:00 UTC | 14 h | 15+ min · Yahoo Finance | |
| KOSPI | 6,012.44 | +374.10 | ▲ 6.63% | 11:05 UTC | 10 h | 15+ min · Yahoo Finance | |
| SENSEX | 73,246.03 | −360.77 | ▼ 0.49% | 10:02 UTC | 11 h | 15+ min · Yahoo Finance | |
| NIFTY | 22,698.85 | −54.35 | ▼ 0.24% | 10:01 UTC | 11 h | 15+ min · Yahoo Finance | |
| ASX | 8,847.30 | +37.40 | ▲ 0.42% | 05:54 UTC | 15 h | 15+ min · Yahoo Finance | |
| TOYOTA | 3,051.00 | −51.00 | ▼ 1.64% | 06:30 UTC | 14 h | 15+ min · Yahoo Finance | |
| SONY | 3,957.00 | −113.00 | ▼ 2.78% | 06:30 UTC | 14 h | 15+ min · Yahoo Finance | |
| NINTENDO | 8,311.00 | −142.00 | ▼ 1.68% | 06:30 UTC | 14 h | 15+ min · Yahoo Finance | |
| TENCENT | 387.60 | +2.40 | ▲ 0.62% | 08:08 UTC | 13 h | 15+ min · Yahoo Finance | |
| BABA | 98.90 | +1.90 | ▲ 1.96% | 08:08 UTC | 13 h | 15+ min · Yahoo Finance | |
| SAMSUNG | 242,000.00 | +20,000.00 | ▲ 9.01% | 06:30 UTC | 14 h | 15+ min · Yahoo Finance | |
| RELIANCE | 1,158.00 | −38.20 | ▼ 3.19% | 09:58 UTC | 11 h | 15+ min · Yahoo Finance | |
| Commodities | |||||||
| WTI | 102.05 | +2.15 | ▲ 2.15% | 20:47 UTC | 10 min | 10–30 min · Yahoo Finance | |
| BRENT | 110.63 | +1.22 | ▲ 1.12% | 20:47 UTC | 10 min | 10–30 min · Yahoo Finance | |
| SOUR | — | — | — | — | — | paid feed only | |
| NG | 3.03 | +0.03 | ▲ 0.90% | 20:47 UTC | 10 min | 10–30 min · Yahoo Finance | |
| RBOB | 3.11 | +0.04 | ▲ 1.42% | 20:47 UTC | 10 min | 10–30 min · Yahoo Finance | |
| HO | 4.63 | +0.01 | ▲ 0.29% | 20:47 UTC | 10 min | 10–30 min · Yahoo Finance | |
| GOLD | 4,082.20 | +7.60 | ▲ 0.19% | 20:47 UTC | 10 min | 10–30 min · Yahoo Finance | |
| SILVER | 54.07 | −0.45 | ▼ 0.82% | 20:47 UTC | 10 min | 10–30 min · Yahoo Finance | |
| PLAT | 1,544.70 | +7.50 | ▲ 0.49% | 20:47 UTC | 10 min | 10–30 min · Yahoo Finance | |
| PALL | 1,014.00 | −14.50 | ▼ 1.41% | 20:46 UTC | 12 min | 10–30 min · Yahoo Finance | |
| COPPER | 6.68 | +0.02 | ▲ 0.36% | 20:47 UTC | 10 min | 10–30 min · Yahoo Finance | |
| CORN | 451.25 | +2.50 | ▲ 0.56% | 18:19 UTC | 3 h | 10–30 min · Yahoo Finance | |
| WHEAT | 599.50 | −10.75 | ▼ 1.76% | 18:19 UTC | 3 h | 10–30 min · Yahoo Finance | |
| SOY | 1,237.00 | −6.00 | ▼ 0.48% | 18:19 UTC | 3 h | 10–30 min · Yahoo Finance | |
| COFFEE | 286.35 | −7.40 | ▼ 2.52% | 17:29 UTC | 3 h | 10–30 min · Yahoo Finance | |
| COCOA | 5,462.00 | −115.00 | ▼ 2.06% | 17:29 UTC | 3 h | 10–30 min · Yahoo Finance | |
| SUGAR | 19.36 | +0.16 | ▲ 0.83% | 16:59 UTC | 4 h | 10–30 min · Yahoo Finance | |
| COTTON | 78.34 | −1.86 | ▼ 2.32% | 15:30 UTC | 5 h | 10–30 min · Yahoo Finance | |
| OATS | 348.50 | −5.50 | ▼ 1.55% | 18:18 UTC | 3 h | 10–30 min · Yahoo Finance | |
| OJ | 143.60 | +0.60 | ▲ 0.42% | 17:59 UTC | 3 h | 10–30 min · Yahoo Finance | |
| CATTLE | 227.03 | −3.82 | ▼ 1.66% | 18:04 UTC | 3 h | 10–30 min · Yahoo Finance | |
| HOGS | 58.85 | −3.17 | ▼ 5.12% | 18:04 UTC | 3 h | 10–30 min · Yahoo Finance | |
| LUMBER | 507.50 | +3.00 | ▲ 0.59% | 19:59 UTC | 58 min | 10–30 min · Yahoo Finance | |
| Futures | |||||||
| ES | 7,754.75 | −3.50 | ▼ 0.05% | 20:47 UTC | 10 min | 10–30 min · Yahoo Finance | |
| NQ | 29,701.75 | −110.25 | ▼ 0.37% | 20:47 UTC | 10 min | 10–30 min · Yahoo Finance | |
| YM | 52,756.00 | +177.00 | ▲ 0.34% | 20:47 UTC | 10 min | 10–30 min · Yahoo Finance | |
| RTY | 2,846.70 | +18.20 | ▲ 0.64% | 20:47 UTC | 10 min | 10–30 min · Yahoo Finance | |
| ZN | 106.08 | +0.03 | ▲ 0.03% | 20:47 UTC | 10 min | 10–30 min · Yahoo Finance | |
| ZB | 107.16 | −0.31 | ▼ 0.29% | 20:47 UTC | 10 min | 10–30 min · Yahoo Finance | |
| ZF | 104.48 | +0.11 | ▲ 0.10% | 20:47 UTC | 10 min | 10–30 min · Yahoo Finance | |
| ZT | 102.09 | +0.10 | ▲ 0.10% | 20:47 UTC | 10 min | 10–30 min · Yahoo Finance | |
| 6E | 1.12 | +0.00 | ▲ 0.18% | 20:47 UTC | 10 min | 10–30 min · Yahoo Finance | |
| 6J | 0.006361 | +0.0000 | ▲ 0.08% | 20:47 UTC | 10 min | 10–30 min · Yahoo Finance | |
| 6B | 1.33 | +0.00 | ▲ 0.14% | 20:47 UTC | 10 min | 10–30 min · Yahoo Finance | |
| BTCF | 80,930.00 | +185.00 | ▲ 0.23% | 20:47 UTC | 11 min | 10–30 min · Yahoo Finance | |
| ETHF | 2,347.00 | +0.50 | ▲ 0.02% | 20:46 UTC | 12 min | 10–30 min · Yahoo Finance | |
| CLF | 102.05 | +2.15 | ▲ 2.15% | 20:47 UTC | 10 min | 10–30 min · Yahoo Finance | |
| GCF | 4,082.20 | +7.60 | ▲ 0.19% | 20:47 UTC | 10 min | 10–30 min · Yahoo Finance | |
| Currencies | |||||||
| EUR/USD | 1.1157 | +0.0026 | ▲ 0.23% | 20:57 UTC | 32 s | a few min · Yahoo Finance | |
| USD/JPY | 157.8290 | −0.0840 | ▼ 0.05% | 20:57 UTC | 4 s | a few min · Yahoo Finance | |
| GBP/USD | 1.3330 | +0.0022 | ▲ 0.17% | 20:57 UTC | 32 s | a few min · Yahoo Finance | |
| AUD/USD | 0.7057 | +0.0029 | ▲ 0.41% | 20:57 UTC | 32 s | a few min · Yahoo Finance | |
| USD/CAD | 1.3995 | −0.0051 | ▼ 0.36% | 20:57 UTC | 2 s | a few min · Yahoo Finance | |
| USD/CHF | 0.8282 | +0.0000 | ▲ 0.00% | 20:57 UTC | 3 s | a few min · Yahoo Finance | |
| USD/CNY | 6.6655 | +0.0000 | ▲ 0.00% | 20:47 UTC | 11 min | a few min · Yahoo Finance | |
| USD/MXN | 18.6270 | −0.0310 | ▼ 0.17% | 20:57 UTC | 3 s | a few min · Yahoo Finance | |
| DXY | 102.1120 | −0.2070 | ▼ 0.20% | 20:47 UTC | 10 min | 15+ min · Yahoo Finance | |
| NZD/USD | 0.5627 | −0.0058 | ▼ 1.02% | 20:57 UTC | 32 s | a few min · Yahoo Finance | |
| EUR/GBP | 0.8369 | +0.0007 | ▲ 0.08% | 20:57 UTC | 3 s | a few min · Yahoo Finance | |
| EUR/JPY | 176.0180 | +0.2750 | ▲ 0.16% | 20:57 UTC | 2 s | a few min · Yahoo Finance | |
| GBP/JPY | 210.2690 | +0.1390 | ▲ 0.07% | 20:57 UTC | 3 s | a few min · Yahoo Finance | |
| EUR/CHF | 0.9236 | +0.0017 | ▲ 0.18% | 20:57 UTC | 2 s | a few min · Yahoo Finance | |
| USD/INR | 95.2100 | +0.1050 | ▲ 0.11% | 20:47 UTC | 11 min | a few min · Yahoo Finance | |
| USD/KRW | 1,342.6200 | +15.7900 | ▲ 1.19% | 20:57 UTC | 7 s | a few min · Yahoo Finance | |
| USD/BRL | 5.3492 | −0.0030 | ▼ 0.06% | 20:57 UTC | 7 s | a few min · Yahoo Finance | |
| USD/ZAR | 16.6017 | −0.0168 | ▼ 0.10% | 20:57 UTC | 3 s | a few min · Yahoo Finance | |
| USD/HKD | 7.8452 | +0.0017 | ▲ 0.02% | 20:57 UTC | 11 s | a few min · Yahoo Finance | |
| USD/SGD | 1.2809 | +0.0004 | ▲ 0.03% | 20:57 UTC | 5 s | a few min · Yahoo Finance | |
| USD/TRY | 49.8246 | +0.0427 | ▲ 0.09% | 20:57 UTC | 2 s | a few min · Yahoo Finance | |
| Digital assets | |||||||
| BTC | 81,138.00 | +469.19 | ▲ 0.58% | 20:57 UTC | 22 s | 1–2 min · CoinGecko | |
| ETH | 2,356.11 | +14.88 | ▲ 0.64% | 20:57 UTC | 8 s | 1–2 min · CoinGecko | |
| SOL | 102.23 | +1.32 | ▲ 1.31% | 20:57 UTC | 22 s | 1–2 min · CoinGecko | |
| XRP | 1.33 | +0.01 | ▲ 0.78% | 20:57 UTC | 22 s | 1–2 min · CoinGecko | |
| BNB | 753.12 | +6.77 | ▲ 0.91% | 20:57 UTC | 8 s | 1–2 min · CoinGecko | |
| DOGE | 0.0801 | +0.0018 | ▲ 2.30% | 20:57 UTC | 8 s | 1–2 min · CoinGecko | |
| ADA | 0.2060 | +0.0013 | ▲ 0.63% | 20:57 UTC | 8 s | 1–2 min · CoinGecko | |
| TRX | 0.3293 | −0.0018 | ▼ 0.53% | 20:57 UTC | 28 s | 1–2 min · CoinGecko | |
| AVAX | 8.99 | +0.13 | ▲ 1.46% | 20:57 UTC | 22 s | 1–2 min · CoinGecko | |
| LINK | 11.79 | +0.34 | ▲ 3.01% | 20:57 UTC | 8 s | 1–2 min · CoinGecko | |
| TON | 1.25 | +0.03 | ▲ 2.86% | 20:57 UTC | 22 s | 1–2 min · CoinGecko | |
| DOT | 1.02 | +0.03 | ▲ 2.82% | 20:57 UTC | 22 s | 1–2 min · CoinGecko | |
| SHIB | 0.00000498 | +0.0000 | ▲ 2.23% | 20:57 UTC | 22 s | 1–2 min · CoinGecko | |
| LTC | 58.75 | +2.08 | ▲ 3.67% | 20:57 UTC | 22 s | 1–2 min · CoinGecko | |
| BCH | 288.65 | −0.35 | ▼ 0.12% | 20:57 UTC | 22 s | 1–2 min · CoinGecko | |
| XLM | 0.1731 | +0.0033 | ▲ 1.92% | 20:57 UTC | 22 s | 1–2 min · CoinGecko | |
| SUI | 0.9449 | +0.0217 | ▲ 2.35% | 20:57 UTC | 22 s | 1–2 min · CoinGecko | |
| NEAR | 4.71 | +0.10 | ▲ 2.11% | 20:57 UTC | 8 s | 1–2 min · CoinGecko | |
| UNI | 7.22 | +0.16 | ▲ 2.24% | 20:57 UTC | 22 s | 1–2 min · CoinGecko | |
| POL | 0.0920 | +0.0003 | ▲ 0.35% | 20:57 UTC | 8 s | 1–2 min · CoinGecko | |
| PEPE | 0.00000498 | +0.0000 | ▲ 10.86% | 20:57 UTC | 22 s | 1–2 min · CoinGecko | |
| BONK | 0.00000318 | +0.0000 | ▲ 4.24% | 20:57 UTC | 8 s | 1–2 min · CoinGecko | |
| FLOKI | 0.00002401 | +0.0000 | ▲ 3.80% | 20:57 UTC | 22 s | 1–2 min · CoinGecko | |
| WIF | 0.1847 | +0.0051 | ▲ 2.84% | 20:57 UTC | 28 s | 1–2 min · CoinGecko | |
| HBAR | 0.0756 | −0.0002 | ▼ 0.24% | 20:57 UTC | 22 s | 1–2 min · CoinGecko | |
| APT | 0.7034 | +0.0189 | ▲ 2.76% | 20:57 UTC | 22 s | 1–2 min · CoinGecko | |
| ARB | 0.1750 | +0.0082 | ▲ 4.88% | 20:57 UTC | 8 s | 1–2 min · CoinGecko | |
| XMR | 597.11 | −7.10 | ▼ 1.17% | 20:57 UTC | 28 s | 1–2 min · CoinGecko | |
| ATOM | 1.64 | +0.02 | ▲ 1.35% | 20:57 UTC | 22 s | 1–2 min · CoinGecko | |
| FIL | 0.9188 | +0.0209 | ▲ 2.32% | 20:57 UTC | 28 s | 1–2 min · CoinGecko | |
| AAVE | 135.66 | +3.37 | ▲ 2.55% | 20:57 UTC | 22 s | 1–2 min · CoinGecko | |
| ETC | 7.62 | +0.05 | ▲ 0.72% | 20:57 UTC | 22 s | 1–2 min · CoinGecko | |
| RENDER | 1.71 | +0.02 | ▲ 1.06% | 20:57 UTC | 22 s | 1–2 min · CoinGecko | |
| ICP | 2.64 | +0.07 | ▲ 2.69% | 20:57 UTC | 22 s | 1–2 min · CoinGecko | |
What is moving markets
- Microsoft stock jumps 4% as cloud growth drives earnings and revenue beat
- Bessent says 'not necessarily' a mistake if the Fed hikes again
- DoorDash's deal to buy Instacart coming as early as Thursday morning, sources tell CNBC
- Alphabet's free cash flow sinks further, Q3 capex expectations miss in worrying sign for AI trade
- Vertiv earnings just sent an upbeat signal about AI ahead of Big Tech results
- Micron’s stock rises after SK Hynix earnings. Here’s its next major test.
- Relative Strength Alert For Fiverr International
- CHS Enters Oversold Territory
- First Trust Latin America AlphaDEX Fund Getting Very Oversold
- United States 12 Month Natural Gas Fund Getting Very Oversold
Headline, source, time and a link to the publisher only — never the article text.
By character
 AikoMP-01 · Rare$1,288$1,236$1,413$1,455+31.00%2,206of 2,222
 BlkHrtMP-02 · Rare$1,375$1,332$1,461$1,569+41.20%2,183of 2,222
 KQLMP-03 · Rare$2,346$2,268$2,451$2,544+14.48%2,208of 2,222
 PsalmMP-04 · Rare$1,296$1,255$1,336$1,486+33.72%2,179of 2,222
 Think RichMP-05 · Rare$2,746$2,644$2,981$2,987+34.43%2,188of 2,222
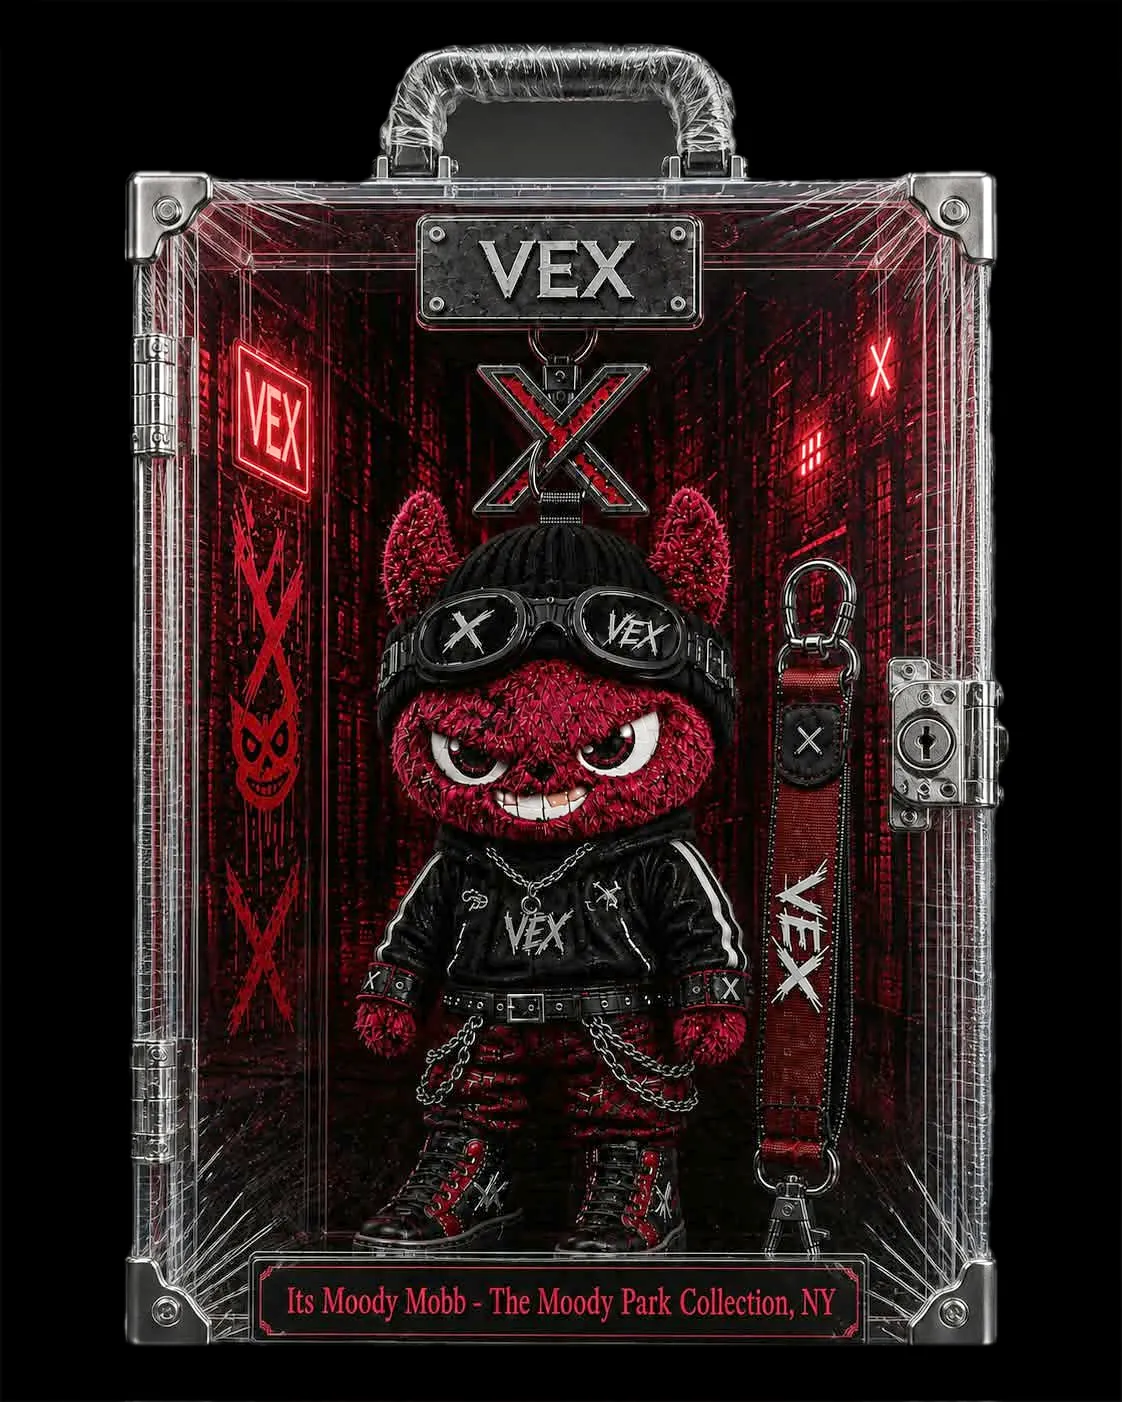 VexMP-06 · Rare$1,549$1,432$1,599$1,581+42.31%2,211of 2,222
 West CannaMP-07 · Rare$2,362$2,181$2,488$2,576+15.94%2,191of 2,222
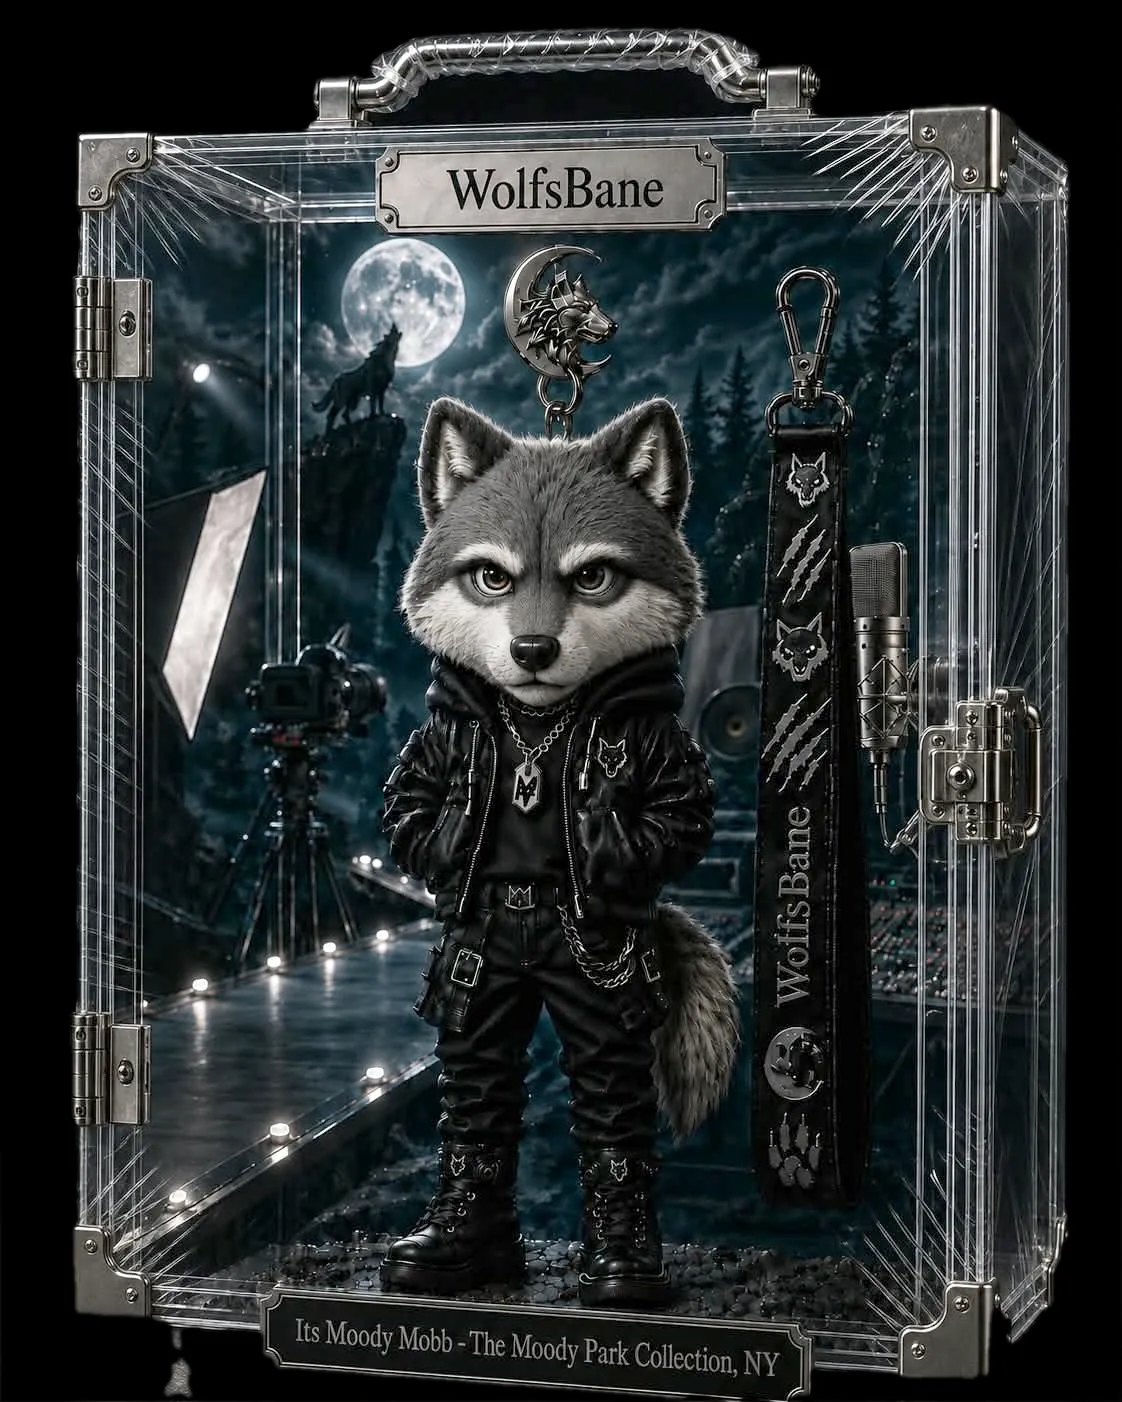 WolfsBaneMP-08 · Rare$1,178$1,055$1,258$1,231+10.83%2,215of 2,222
By house · illustrative
Last sale is the last simulated transaction. Best bid is the highest anyone will pay right now; best ask the lowest anyone will sell for. Village Market Value is the estimate that moves between sales — it is pulled by the live book and by permanent supply losses, but it is capped so it can never drift more than 25% from the last real trade. Nobody sets it by hand.